
The product
Every decision visible,
every actor named.
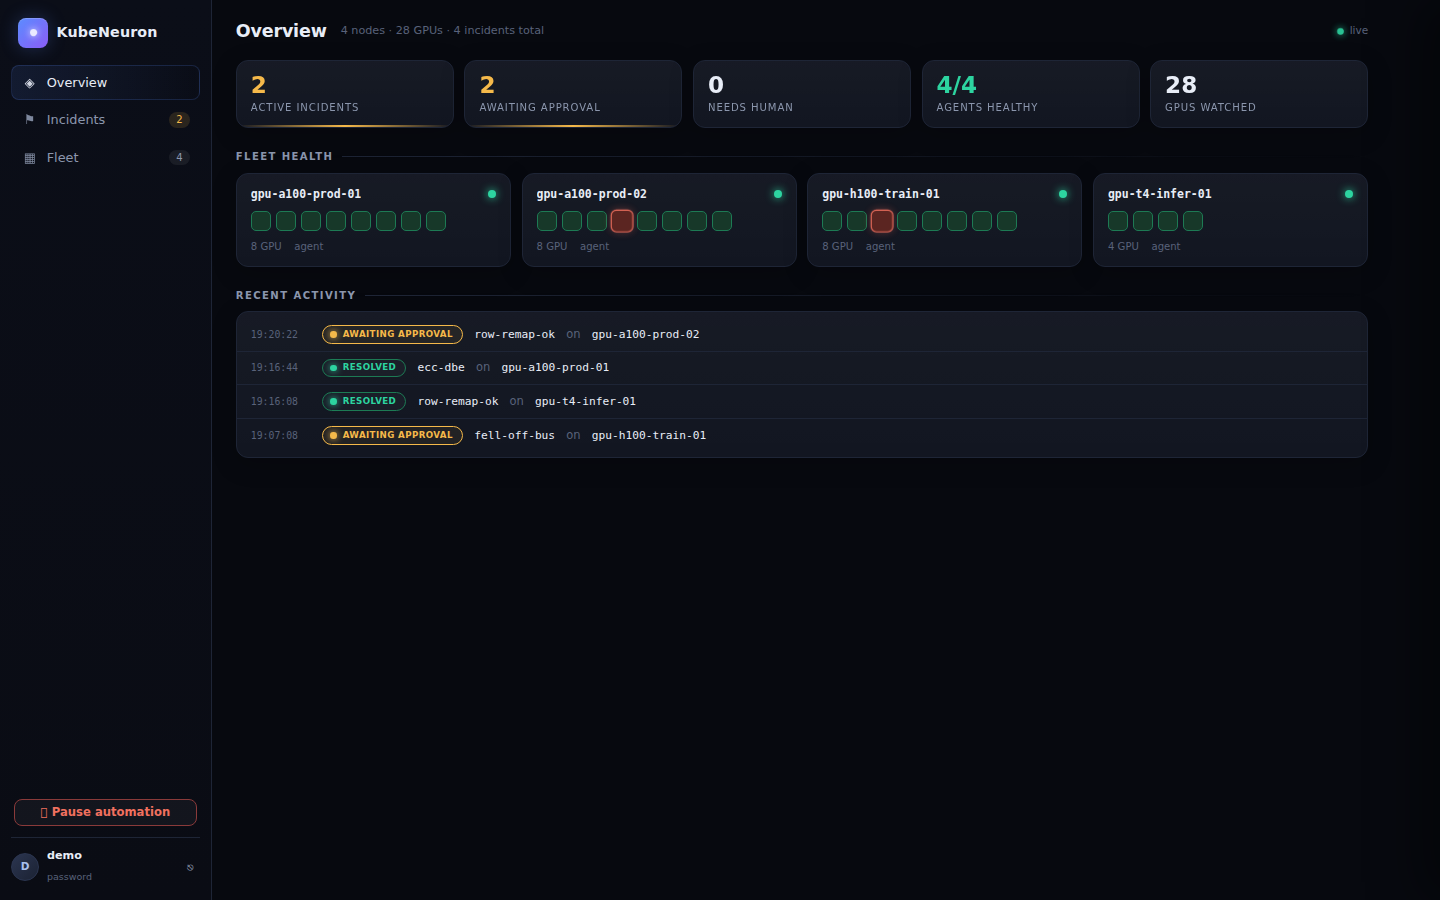
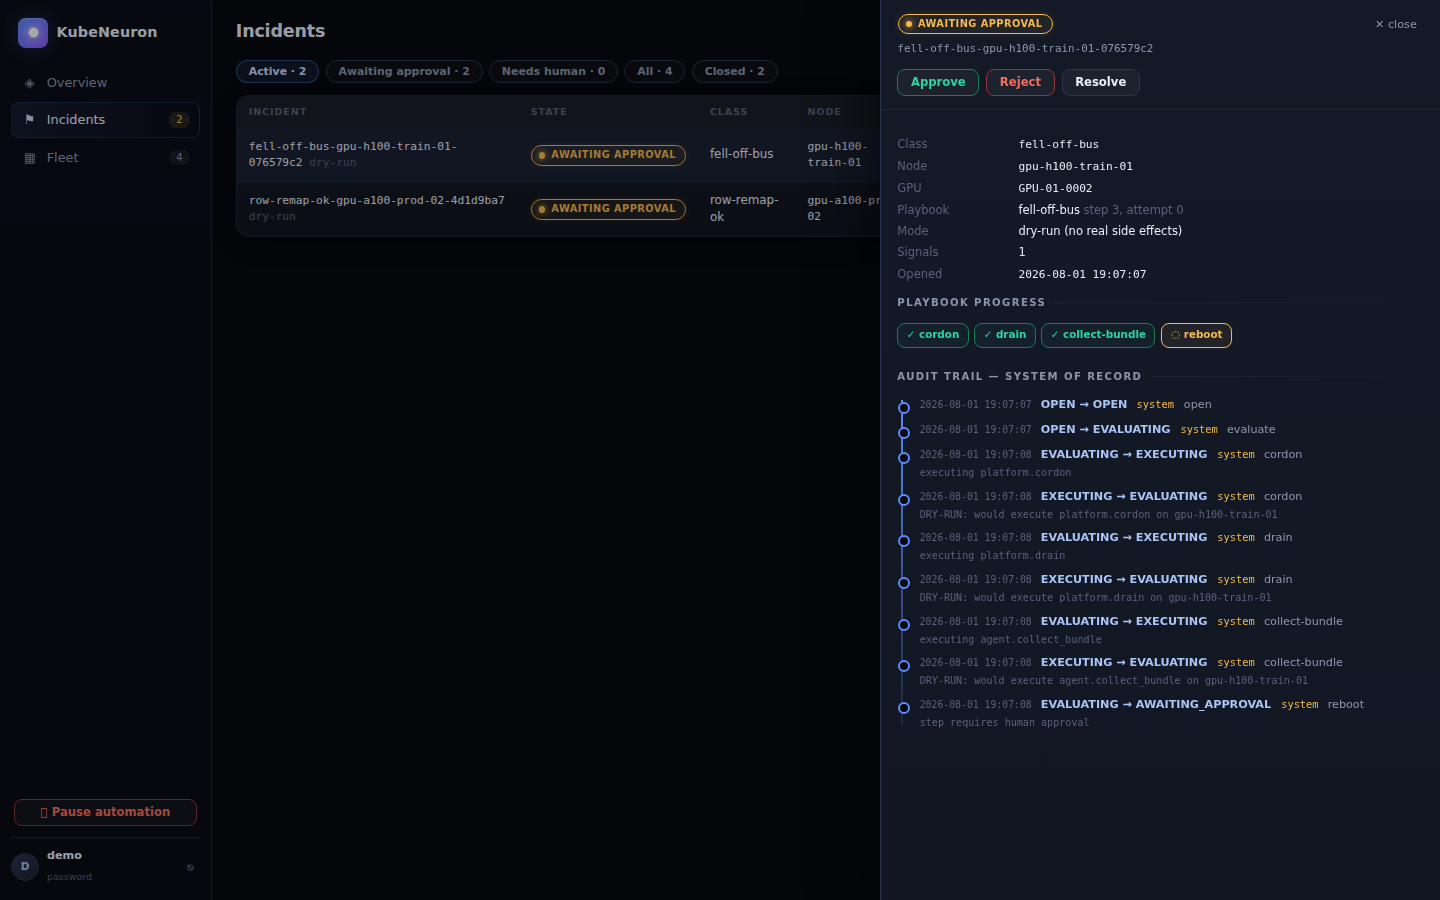
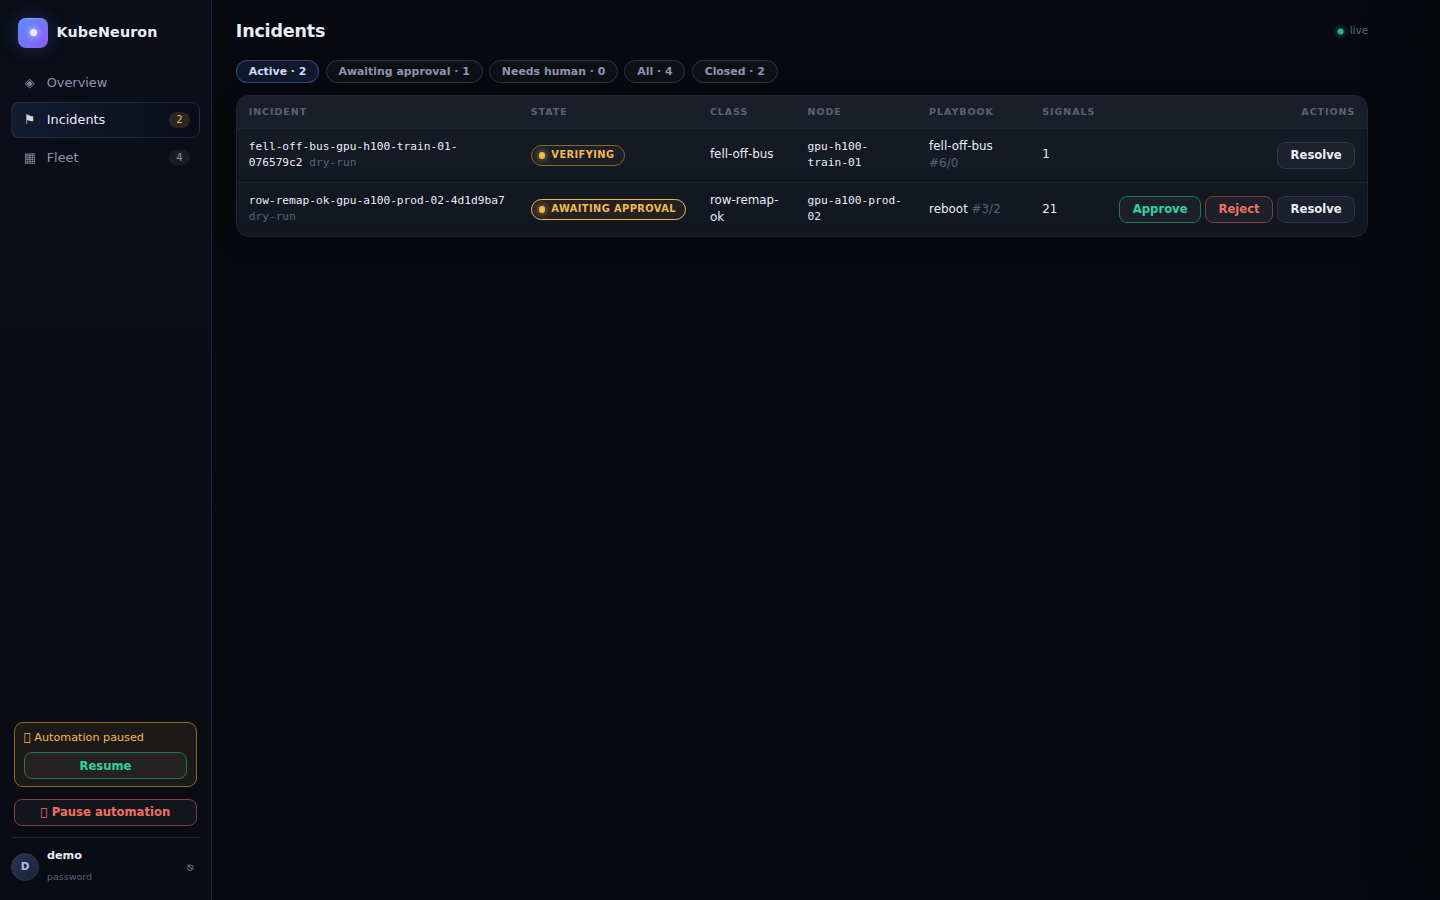
The control panel ships inside the controller, so there is no separate frontend deployment. SQLite covers small installations; PostgreSQL backs the highly available pair. Sign in with a password from a Kubernetes Secret, your SSO provider, or a Kubernetes credential; whatever you approve is recorded under that identity.
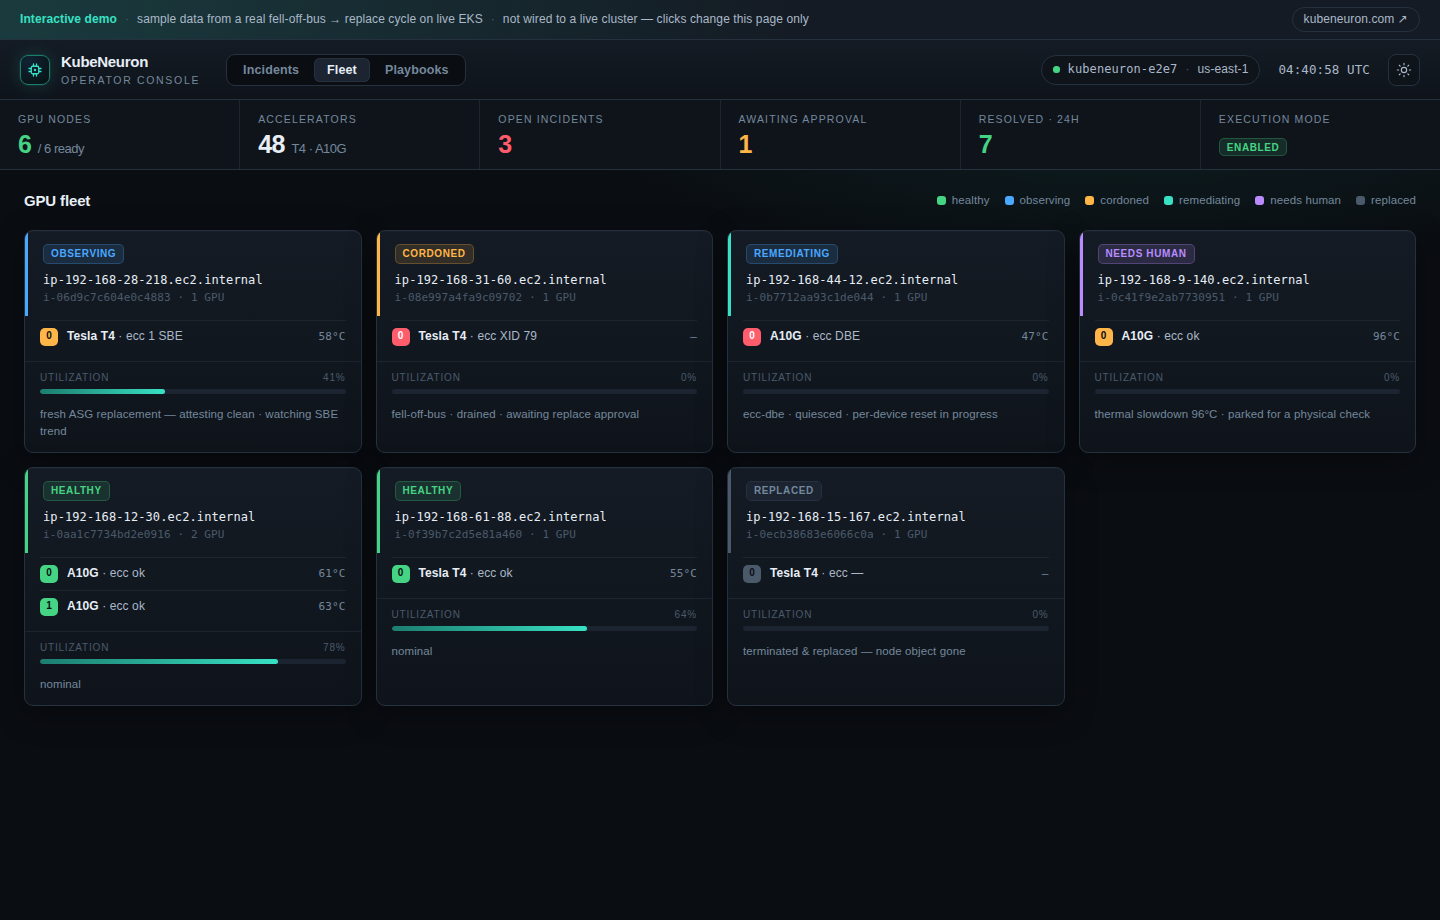
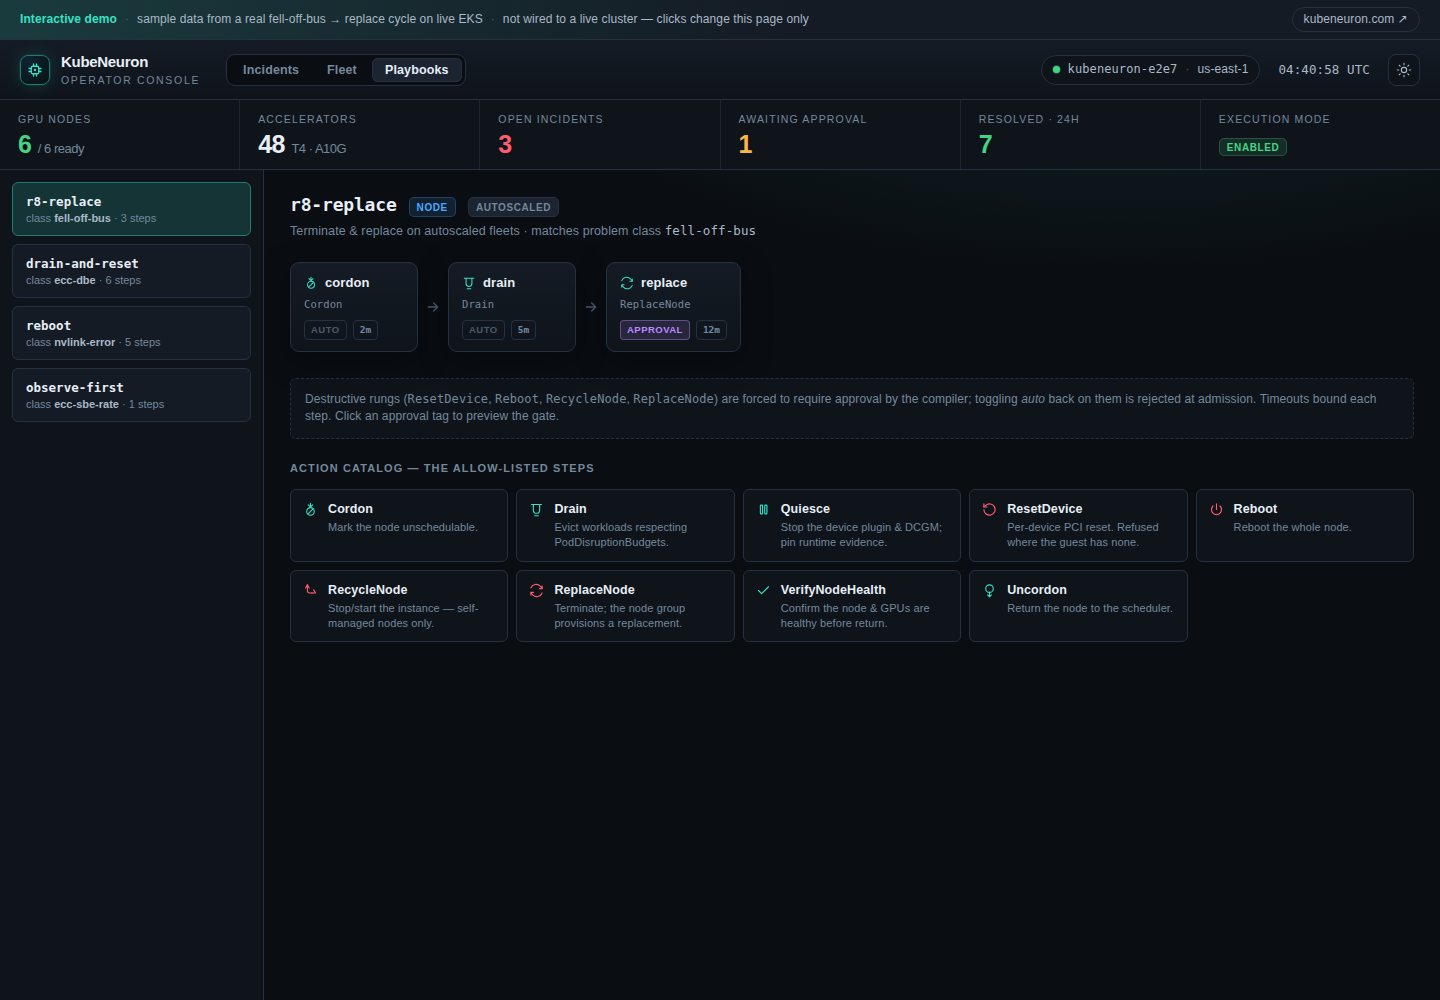
fell-off-bus incident approved at its gate, the node replaced, then the fleet map and playbook flow. Every value is from a real remediation cycle on live EKS.Open the live operator console Full product tour with a recorded demo
What recovery gave back
“Resolved” is not
a capacity number.
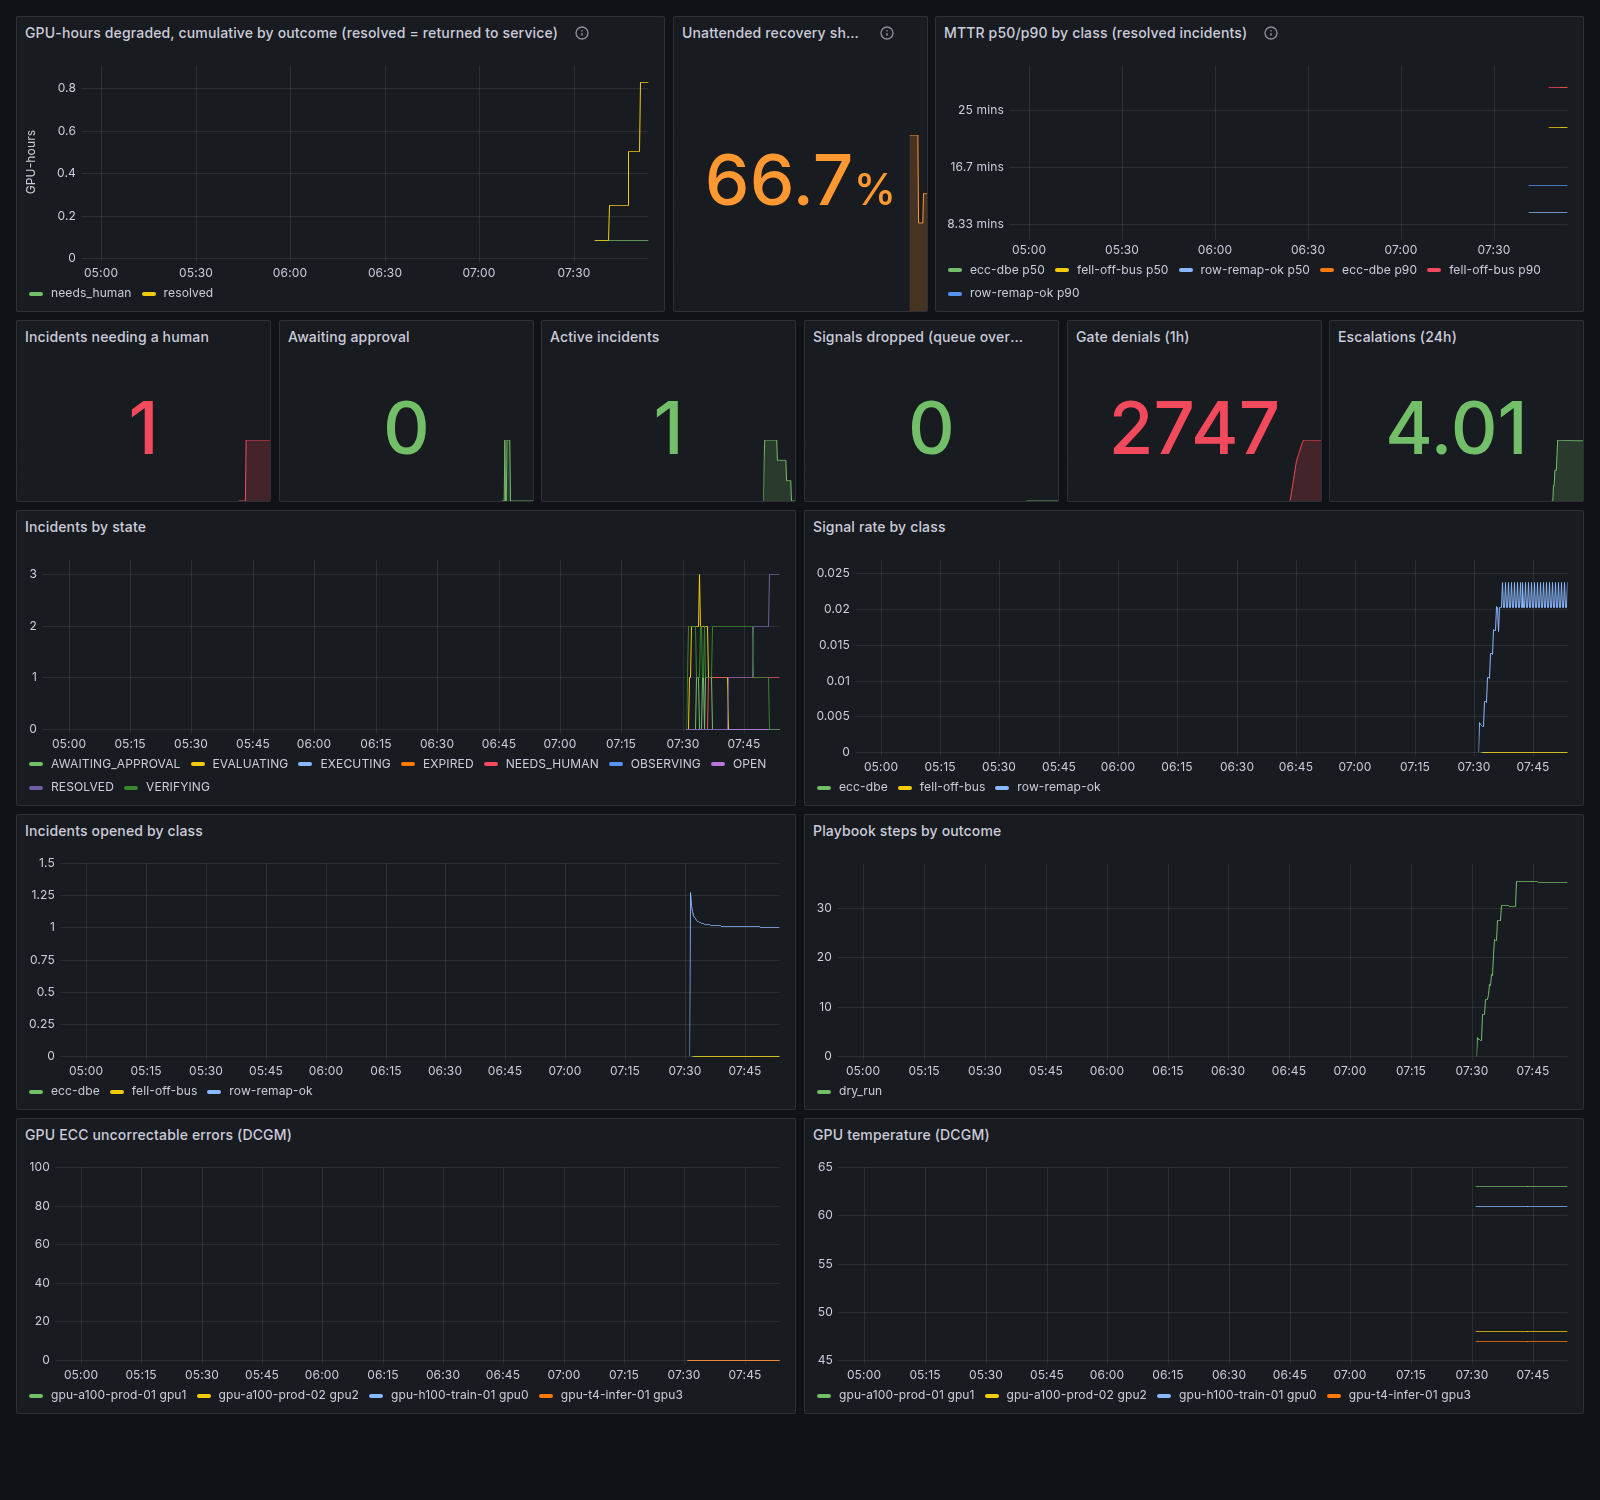
An incident closing tells you the workflow finished. It does not tell you how much accelerator capacity came back, how long it took, or how often the fleet healed without waking anybody. KubeNeuron measures all three from its own incident store — exact, not sampled, and reproducible from a database snapshot.
366.5GPU-hours recovered, of 412.8 degraded — 88.8%
27 of 31recoveries that finished without a human — 87.1%
12m22smedian time to resolution (p50, n=31; p90 52m0s)
kubeneuronctl report --since 30d
degraded GPU-hours     412.8
recovered GPU-hours    366.5       88.8% of degraded
incidents recovered    31 of 37    83.8%
  without a human      27 of 31    87.1% of recovered
MTTR (resolved, n=31) p50 12m22s p90 52m0s- Recovered means resolved. An incident parked for a human keeps accruing degraded time until somebody closes it. Nothing is credited to automation that automation did not finish.
- Degraded, not lost. A degraded GPU may still have been serving. The number is honest about what it counts.
- Dry-run recovers nothing. A pilot still gets the numbers — reported separately, labelled as the simulation it is, so the headline figure cannot flatter a fleet nothing has touched.
Build the safe path first
Run a calmer GPU fleet.
Read the source, run the dry-run ladder, and tell us where the policy model breaks.